Open Source Software Ecosystem for Cloud Observability: An Overview and Trends
- 10.1145/3786163.3788453
-
Cite
@inproceedings{fontes-sesos-2026,
  author    = {Gabriel Silva Fontes and Vasilios Andrikopoulos and Elisa Yumi Nakagawa},
  title     = {{Open Source Software Ecosystem for Cloud Observability: An Overview and Trends}},
  booktitle = {SESoS '26: Proceedings of the 14th IEEE/ACM International Workshop on Software Engineering for Systems-of-Systems and Software Ecosystems},
  series    = {SESoS '26},
  year      = {2026},
  month     = apr,
  pages     = {9--15},
  publisher = {Association for Computing Machinery},
  isbn      = {9798400723957},
  doi       = {10.1145/3786163.3788453},
  url       = {https://doi.org/10.1145/3786163.3788453},
}
- Gabriel Silva Fontes
- Vasilios Andrikopoulos
- Elisa Yumi Nakagawa
14th IEEE/ACM International Workshop on Software Engineering for Systems-of-Systems and Software Ecosystems (SESoS '26)
Table of contents
Abstract
Context: With the adoption of cloud computing and the evolution of IT and software engineering practices, observability, the ability to systematically measure and monitor software systems, becomes a growing concern. Cloud computing is very heterogeneous, and thus creating, maintaining, and observing systems built on it requires integration of multiple tools. Open source software (OSS) tooling emerged as a de-facto standard in multiple areas, including cloud observability. The ecosystem formed by OSS observability tooling is large and often difficult to navigate.
Objective: The main goal of this paper is to present the OSS Ecosystem formed by cloud computing observability tooling, by providing an overview of the main tools and identifying trends on their integration.
Method: We searched the literature for studies on cloud observability and used an automated named-entity recognition (NER) method to extract candidate observability tools from abstracts. We selected the OSS observability tools according to well-defined criteria. Following this, we used keyword matching on the tools’ source codes, revealing integration code, documentation, and other types of relations.
Results: As a result, we found 45 OSS observability tools and derived quantitative measures on their relations to one another. The tools serve different roles in observability stacks, with our results serving as a proxy measure on how strongly they relate to one another.
Conclusion: We present an overview of different tools, how frequently they appear, their functionality, and a visualization of their relations. Some trends are identified, such as the centrality of some tools (e.g. Prometheus), common stacks (e.g. ELK, TICK), and outliers (Thingspeak). We discuss topics such as measuring relations, standardization, proprietary lock-in, among others.
CCS Concepts: Software and its engineering → Cloud computing
Keywords: Open Source Software, Cloud Computing, Observability, Mining Software Repository
Introduction
Catalyzed by the revolution brought by the public cloud and the advance of modern IT practices, such as the Site Reliability Engineering concept (Beyer et al. 2016) and the DevOps movement, systems administration is shifting from operational into an engineering domain (Beyer et al. 2016). With this shift, a need to systematically measure and monitor software systems emerge that is known as observability. Observability is a concept originating from control theory, meant to measure the degree to which a system’s internal state can be inferred from its output at any point in time (Niedermaier et al. 2019). Cloud observability, in turn, is the degree to which (cloud) infrastructure, applications deployed on this infrastructure, and their interactions can be monitored using data such as logs, metrics, and traces (Picoreti et al. 2018).
Cloud computing is, by its very nature, a heterogeneous combination of different platforms, software, and systems. Ranging from on-premises infrastructure and traditional workloads, to a multitude of different cloud providers and cloud-native container orchestration, plus dozens of different configuration management tools (with varying degrees of compatibility), the list goes on and on. In this scenario, it is challenging to create, maintain, and observe systems that rely on such a diverse ecosystem. This diversity makes the interoperability requirement critical (Loutas et al. 2011) (Lewis 2013). Open Source Software (OSS) is a natural fit for this, as its effect on standardization and commodification (Linden, Lundell, and Marttiin 2009) forces cloud vendors to interoperate. There are many cases where an OSS’ potential for interoperability helped it become a dominant force in software engineering tooling, including Docker/OCI, Kubernetes, Linux, Git, LSP, among others. Cloud observability is no different, as we will discuss further in this work.
Just as the cloud systems that it aims to observe, the OSS tools used for cloud observability are similarly diverse and heterogeneous. This is an ecosystem that includes tools for tracing, benchmarking, logging, aggregation, storage, visualizations, alerting (Beyer et al. 2016), with many different tools being combined to create observability stacks that are used in different contexts and business domains. Understanding this ecosystem becomes crucial for both researchers in the cloud computing domain, as well as practitioners looking to build more reliable and observable cloud-based systems. This understanding, however, is not just about which tools there are out there, but how they integrate and which role they play in an observability stack.
While there is some non-academic effort to better understand subsets of this ecosystem (“CNCF Landscape,” n.d.), current literature lacks a wider study on the OSS cloud observability ecosystem. With that in mind, the main goal of this paper is to present an overall view of the OSS tooling ecosystem used for cloud observability. To achieve our goal and identify trends in this field, we defined two research questions (RQs):
-
RQ1: What are the most relevant OSS tools in cloud observability stacks?; and
-
RQ2: How are OSS tools combined to form cloud observability stacks?
Following this, we searched the scientific literature and located 3068 studies, from which, through an automated extraction followed by manual selection, we identified 45 OSS observability tools. As a main result, we observed the centrality of some tools, and tools that cluster together. We intend that the overview presented in this paper can bring implications for both practitioners and researchers.
The remainder of this paper is structured as follows: Section 2 outlines the research method; Section 3 reports the main results; Section 4 presents our main findings, threats to validity, and future work; Section 5 concludes our work.
Research Method
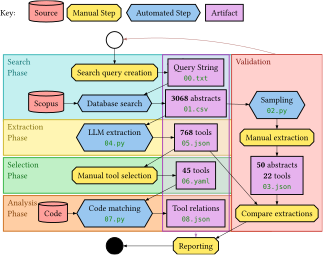
Figure 1 provides an overview of the research method and the reproduction package files that correspond to each step. The reproduction package is made available both in the supplementary material and online1 to replicate the entirety of this research.
Search Phase
To build our initial set of tools, we used a large population of research studies as basis. For that, we searched Scopus2 with the following query:
TITLE-ABS-KEY(
    cloud AND tool AND (
      observability OR logging OR monitoring
    )
  ) AND LIMIT-TO(SUBJAREA,"COMP")
Our goal includes, but is not limited to, finding more niche tools and thus benefits from a large and diverse sample size. To avoid missing relevant tools, this search query intentionally did not try to exclude research software nor proprietary software, thus leaving this filtering for manual selection, as described in Section 2.3.
The search resulted in a set of 3068 studies, which were exported into a CSV file in the following format: "Title", "Year","DOI","Link","Abstract". This data is available in the reproduction package as 01 -scopus-search-results.csv.
Extraction Phase
This is a problem in the class of Named-entity Recognition (NER) (Pakhale 2023), albeit a single-class one. As the intent is to extract tool names mentioned in the studies, a method that can be aware of context, such as BERT or an LLM, is ideal. For this extraction, due to ease of access and previous experience, we decided to use an LLM to extract the tools from abstracts.
The reason for using the abstracts alone, besides ease of automation and availability, is that an abstract can fit together with the LLM’s prompt in most models’ context windows, drastically reducing hallucinations and costs when compared to the full texts. The main risk from this strategy is missing tools that only appear in the full text; hence, we mitigated it in two ways: (i) by using a large amount of studies; and (ii) by calibrating the prompt using a validation set, as discussed next.
Validation sampling and extraction
A validation set of 50 manually extracted abstracts was created. This set was used to estimate precision and recall of the overall dataset and to calibrate the LLM prompt used for extraction. The first attempt was by randomly sampling abstracts. After analysis, it was evident that the negatives (i.e., abstracts not containing any observability tool names) made up around 80-90% of the corpus, making the data very sparse. To get a set with a higher share of positives, we decided to use a combination of keyword spotting (by matching the text with a few known observability tools3) and random sampling. The set is composed of 42 studies originating from keyword match and 8 from random sampling. The script that reproduces this step is available in the reproduction package as 02-validation-set-script. py. The authors then manually extracted tools from these abstracts, inserting the annotations into the dataset, which is available in the reproduction package as 03-validation-set- results.json. The validation set was used to evaluate and refine the study, including the search query and LLM prompt, as discussed next.
LLM extraction
The extraction method consists of feeding each study’s abstract to an LLM (in this case, DeepSeek-V3 (DeepSeek-AI 2024)), with the following prompt:
“ You will receive a paper abstract that relates to cloud observability/monitoring/logging/tracing tools. Enumerate all observability/monitoring/logging/tracing tools mentioned in it. Respond with the names separated by comma: tool1,tool2,tool3. If there are no relevant tools, reply with an empty string. ”
This prompt was the result of several rounds of evaluation and calibration. By using the LLM to extract tools from the validation set, we achieved recall 97%, precision 69%, and $F_1$ 80% (66 true positives, 30 false positives, and only 2 false negatives). The key metric here is the recall, as this LLM extraction is then used for a manual selection, so it is crucial that false negatives are minimized, even if this leads to more false positives.
From the full set, the LLM extracted a total of 768 candidate tools, originating from 774 studies (25% of 3068 total studies). This step can be fully reproduced via the script 04-llm-extraction-script.py, and its results are available in 05-llm-extraction-results.json. These tools were then manually selected, as detailed in Section 2.3.
Selection Phase
We manually examined the 768 candidate tools and the studies they appeared on and selected the tools according to the following selection criteria:
-
Inclusion Criteria (IC):
-
Exclusion Criterion (EC):
- EC1: The tool is a piece of research software and not otherwise available as an actual FOSS project on the web or mentioned anywhere else on the web besides the studies that introduce it.
By applying this criteria, we selected a total of 45 tools, as shown in Table 1. Besides the tool name and studies it originates from, we also annotated each tool with:
-
A list of its relevant software repositories (e.g., Git, SVN), located via web searches.
-
Its main functions/roles, also located via web searches, and organized roughly based on (Kosińska et al. 2023):
-
instrumentation(Instrumentation): allows systems to export observability data (e.g. libraries, exporters). -
collection/processing(Data Collector): aggregates, processes, and collects data. -
storage(Data Backends): long-term storage, querying. -
visualization/alerting/analysis(Analysis/Visualization): understanding of the system, root cause analysis, discovering “unknowns”.
-
This phase was conducted by the first author over the course of a few days, with web searches and consensus meetings with the second author to ensure correctedness. This data is available in the reproduction package as 06-tool-selection- manual.yaml. This is part of RQ1 and further explored in Section 3.1.
Analysis Phase
Our main goal in this phase is to find the relations between the tools, to answer the RQ2. For that, we downloaded their source code, and, for each tool, programmatically matched occurrences of every other tools’ names in its codebase. This step can be reproduced using 07- tool-code-occurrences-script. py and its results are available as 08-tool- code-occurrences-results.json.
These numbers represent how much a tool’s codebase is aware of and/or coupled to each other tool, and includes integration features, documentation, tests, dependencies, etc. This is part of RQ2 and is further explained in Section 3.2. A deeper study on the nature of each individual relation is out of scope for this study, but we briefly discuss this in Section 4.3.
Results
This section focuses on answering the two RQs defined in Section 1.
OSS tools in Cloud Observability Stacks
We selected 45 tools, which can be tracked back to the abstracts of 111 studies in our set (4% of 3068 from the initial search). Table 1, in the Appendix, contains the full set of selected tools, the amount of abstracts they appear on, and our annotations on the main functions each of them provide in an observability stack (as per (Kosińska et al. 2023)). As it can be seen from the table, there is a long tail of tools with presence in a single study each, while a few tools such as Thingspeak and Prometheus dominate the discourse.
Figure 2 visualizes how frequently each tool appears, in number of studies. Notoriously, Prometheus and Grafana are very frequently mentioned in the studies, which correspond to our expectations and industry experience, where the two are frequently combined for a basic metric+visualization stack. Thingspeak being highly mentioned, while unexpected, is possibly an indicator that IoT research frequently intersects with cloud computing.
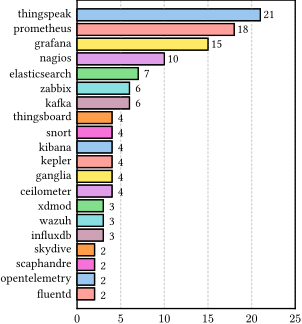
Figure 3 shows how frequent each role (as defined in Section 2.3) is. Some tools have multiple roles (e.g. Grafana has both visualization and alerting). We can see a very high frequency in the collection role; besides dedicated collectors, most instrumentation and processing tools seem to have some sort of collection/aggregation mechanism built-in.
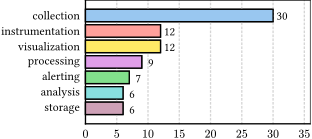
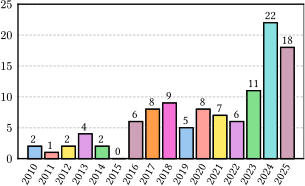
Figure 4 shows the yearly distribution of studies with at least one selected tool. We can see that there is a growing trend, possibly indicating the increased interest in the area. Our data contains studies from up until October 2025, thus 2024 studies are slightly more present than 2025 in the graph.
Answering RQ1: Prometheus is ubiquitous in the cloud observability ecosystem. Nagios, Grafana and ElasticSearch are also frequent appearances. Thingspeak is an interesting outlier, representing the intersection with IoT. Collection functionality is the most frequent, followed by instrumentation and visualization.
Combinations of OSS Tools in Cloud Observability Stacks
To better visualize the relation data, we conducted a network analysis in it, with the results shown in Figure 5. For this figure, we represent each tool as a node.
The graph edges are directed and weighted, serving as visualization of how much a tool X relates to another tool Y. This is obtained, as described by Section 2.4, through matching Y’s name on X’s codebase, and represents relations such as integration features, comments mentioning a borrowed snippet, documentation (usually comparing an alternative tool or documenting integration), tests, and usage as libraries. As the codebase sizes vary, the edge weights are normalized with the other edges originating from the same node. Edges whose weights were lower than 0.05 (i.e. 5% of all keyword matches that codebase has) were hidden from the visualization, for improved visibility.
The node size is derived from the sum of the weights of connections with that node as destination, interpreted as how important the tool is to the ecosystem. The node colors are a visualization of community clustering, that groups tightly connected nodes together.
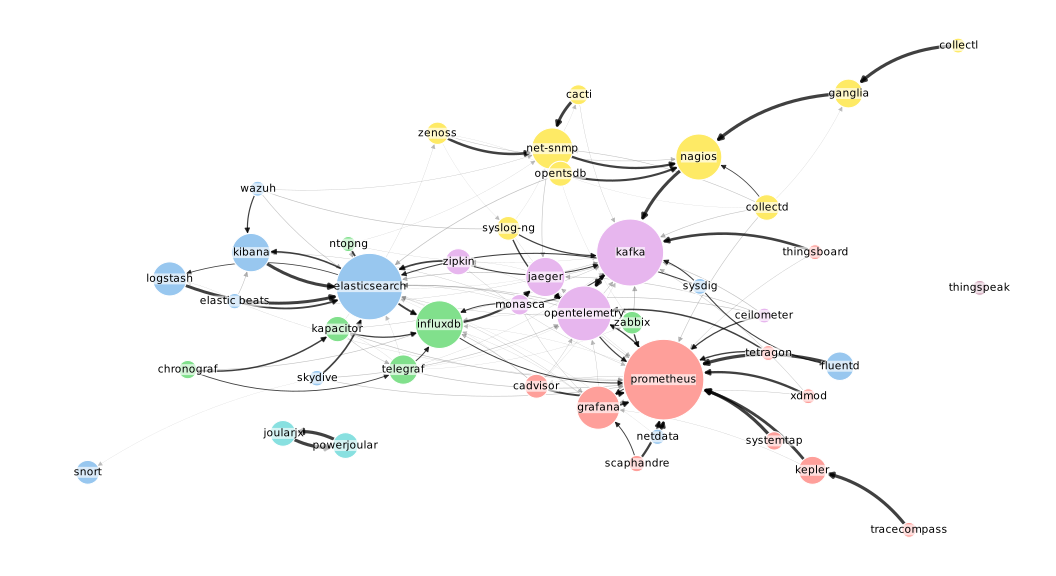
We can see in the figure how many tools relate to Prometheus; due to its format being the dominant one for metrics, most other tools export metrics that are compatible with Prometheus. Thingspeak is very disconnected from the other tools, which hints that IoT tooling tends to be more standalone. JoularJX and Powerjoular, a pair of tools built together to, respectively, collect and aggregate power consumption data, also appear isolated yet tightly coupled together. Some stacks can be clearly seen being formed in the figure: the ElasticSearch+Logstash+Kibana ELK stack, and the Telegraf+InfluxDB+Chronograf+Kapacitor TICK stack being some obvious ones. The directionality of the relations is also representative of how the tools behave, with Grafana heavily relating to Prometheus (it has a Prometheus datasource built-in (“Prometheus Data Source - Grafana Documentation,” n.d.)), but not the other way around (i.e. Prometheus knows almost nothing about Grafana).
Answering RQ2: some common stacks appear in this research, such as ELK and TICK. Some tools are highly integrated in the ecosystem, with Prometheus being a central piece. Thingspeak is an outlier and shows that IoT tends toward standalone solutions.
Discussion
This section discusses our main findings, the threats to the validity of this study, and future work.
Main Findings
The main findings resulting from our investigation of OSS tools for cloud observability are:
-
Quantitative code matching can be a good proxy to find relations between codebases. Our approach of matching the names of each tool on other tools’ codebases worked. Figure 5 clearly shows clustering between well-known combinations: ElasticSearch+Logstash+Kibana (ELK stack), Telegraf+InfluxDB+Chronograf+Kapacitor (TICK stack). We can also see library usage (e.g., OpenTelemetry), the most ubiquitous tools (Prometheus) being highly referenced to, as well as some disconnected clusters (e.g., Powerjoular+JoularJX, Thingspeak). Notably, our approach is very accurate in modeling directed relations, such as Grafana integrating with Prometheus (“Prometheus Data Source - Grafana Documentation,” n.d.), but not the other way around. Finally, our approach is heavily automated, and thus scales much better than the alternatives that involve manual labeling or more qualitative analysis. It should be interesting to apply the code matching technique to explore the relations between projects in different Software Ecosystems.
-
Some tools are de-facto standards, bringing interoperability but risking over-reliance. It is interesting to see how Prometheus has become so ubiquitous that there are references to it in the code of basically every single cloud observability tool that exists. If a software exports metrics, it is probably in the Prometheus exposition format. Although Prometheus’s community-based governance brings some safety, over-reliance on a single implementation can be problematic, thus bringing the need of standardization. OpenTelemetry has recently emerged as a more standardized framework for different aspects of observability (including compatibility with the Prometheus exposition format) (“Prometheus and OpenTelemetry - Better Together” 2024), and it is interesting to see adoption grow. The connection graph we built can be a helpful metric to determine which OSS tools are becoming critical, thus should be prioritized for standardization and/or alternative implementations by OSS communities and funding agencies.
-
OSS and standardization can challenge proprietary lock-in. Our data extraction step yielded some proprietary software (e.g. CloudWatch, AzureWatch), most of them specific to a single cloud vendor. These were, however, often accompanied by OSS tools, a reminder that some of the OSS tools are so ubiquitous that vendors are effectively forced to implement support for them, further showing the strength OSS has in standardization and interoperability. Practitioners should consider prioritizing OSS when adopting observability tooling that needs to interoperate, for example, in multi-cloud scenarios.
-
The line between an observability tool and a tool that can be used for observability can be thin. During our manual selection step, some tools were difficult to classify. For example, Kafka is not necessarily built for observability solutions, but its usage is so frequent that it becomes clear that it should be labeled as such. But what about other message queues? Or storage systems? Further research is required to effectively draw this line.
Threats to Validity
As with any secondary studies, threats to validity must be considered as well as mitigation actions, as discussed below:
-
Not all tools are mentioned in scientific literature. There are a few tools the authors know about from their exposure to cloud observability solutions that did not appear in any of the abstracts our search yielded. This includes Mimir, Loki, Graphite, and Thanos. This means that including other datasources and analysis techniques could provide a more complete set of tools. This is an acknowledged limitation in our study.
-
Sparsity of dataset. The abstract dataset is very sparse, making validation harder. Only 4% of the total corpus includes at least one tool from the final selection. We mitigated this by building a validation set that included both known tools as well as randomly sampled studies.
-
LLM bias. Although we calibrated the prompt to minimize false negatives, the LLM can be biased towards more well-known tools. We mitigated this by inspecting the abstracts of all 774 extracted studies (i.e. studies from which the LLM extracted at least one tool), this same inspection is, however, not possible in the negative population, as it is very large. The mitigation provided by the validation set (Section 2.2.1), with a high recall value, is considered sufficient.
-
Abstracts may not contain every tool relevant to the work. Using only the abstracts (as opposed to the fulltexts) can leave out relevant tools. This is somewhat mitigated by the large corpus of studies we used, and is a tradeoff we accepted to build a more automated research method.
-
Code matches can contain false positives. Some codebases, such as ElasticSearch’s, contain files such as wordlists. This is mitigated by making the weights relative and discarding less relevant edges. Future research could involve additional heuristics.
-
Code matches can contain transitive relations. Transitive dependencies/integrations are also frequently matched, which might be an issue if the intention is to only model direct ones. This can be partially mitigated by excluding lockfiles. We decided to not qualitatively differentiate the nature of each relation, so this is considered out of scope for this paper.
-
Human error during selection. As with any classification based on human decisions, our selection phase (Section 2.3) could contain errors or be biased. This was mitigated by consensus between the authors and by carefully researching each candidate tool, as detailed in the section.
Future Work
Based on the results of our investigation, we can suggest the following future work:
-
Qualitative analysis on the relations. Our approach with the relations between tools was very quantitative, with no regard for the nature of the code nor any attempt to filter false positive matches. By conducting a more qualitative analysis of each individual relation identified, one could gain a better understanding of the relation between tools, and how good of a proxy the quantitative analysis is.
-
Other datasources besides academic studies. Although useful for casting a wide net, academic studies might not be enough to locate all tooling, specially emerging ones. Other methods such a multivocal literature reviews to find the set of tools might be interesting to explore.
-
Applying our method to other ecosystems. The code keyword matching approach is simple, very scalable, and seems to provide good results. One could apply this technique to other ecosystems.
-
A better definition of observability tooling is needed. Some tools are used in observability but do not define themselves as observability tools. Some better heuristic to make this classification could be explored.
-
Other heuristics for finding relations. Research on more heuristics for the relations can be interesting. For example, by analyzing the common contributors between two projects, one could measure integration and/or cross-pollination between different software projects.
Conclusions
As IT operations shift into an Engineering activity, Observability also grows as an important topic for SE research. In our work, our objective was to provide an accurate starting point to researchers exploring the OSS Observability ecosystem. Our research shows a selection of 45 OSS tools, a categorization on their functionality, and a quantitative measure of the relations between one other. A few tools are shown to have a central role in the ecosystem, such as Prometheus, others appear clustered in stacks, such as ELK (ElasticSearch, Logstash, Kibana) and TICK (Telegraf), InfluxDB, Chronograf, Kapacitor). We also showcase some outliers, such as Thingspeak which does not relate to any other tool we have researched, as well as tools that appear isolated as a pair, such as JoularJX and PowerJoular.
Our methodology is very automated and can be helpful for any exploratory study of a Software Ecosystem where source code is available for analysis. This sort of overview can be helpful for practitioners to locate additional components their observability stack might be missing, as well as to discover alternatives for tools they are using.
Acknowledgments
This study was financed by São Paulo Research Foundation (FAPESP) (2023/00488-5), National Council for Scientific and Technological (CNPq) (313245/2021-5), Coordenação de Aperfeiçoamento de Pessoal de Nível Superior (CAPES) (001), and by ITEA4 and RVO under grant agreement No. 22035 MAST (https://itea4.org/project/mast.html).
Selected Tools
| Tool | Studies | Roles |
|---|---|---|
| thingspeak | 21 | collection, storage |
| prometheus | 18 | instrumentation, collection, alerting |
| grafana | 15 | visualization, alerting |
| nagios | 10 | collection, alerting |
| elasticsearch | 7 | storage |
| zabbix | 6 | collection, alerting, visualization |
| kafka | 5 | processing |
| ceilometer | 4 | collection |
| ganglia | 4 | collection, processing, visualization |
| kepler | 4 | instrumentation |
| kibana | 4 | visualization |
| snort | 4 | collection |
| thingsboard | 4 | collection, processing, visualization, analysis |
| influxdb | 3 | storage, processing |
| wazuh | 2 | instrumentation, alerting, visualization, collection, analysis |
| xdmod | 2 | instrumentation, collection, analysis |
| fluentd | 2 | collection |
| opentelemetry | 2 | instrumentation, collection |
| scaphandre | 2 | instrumentation, collection |
| skydive | 2 | collection |
| cacti | 1 | collection, visualization |
| cadvisor | 1 | collection |
| chronograf | 1 | visualization |
| collectd | 1 | instrumentation, collection |
| collectl | 1 | collection |
| elastic beats | 1 | instrumentation |
| flume | 1 | collection, processing |
| jaeger | 1 | collection, visualization |
| joularjx | 1 | instrumentation, collection |
| kapacitor | 1 | processing, alerting |
| logstash | 1 | collection, processing |
| monasca | 1 | storage, processing |
| netdata | 1 | collection, alerting |
| net-snmp | 1 | collection |
| ntopng | 1 | instrumentation, collection |
| opentsdb | 1 | storage |
| powerjoular | 1 | collection |
| sysdig | 1 | instrumentation |
| syslog-ng | 1 | collection |
| systemtap | 1 | instrumentation |
| telegraf | 1 | processing, collection |
| tetragon | 1 | collection, analysis |
| tracecompass | 1 | visualization, analysis |
| zenoss | 1 | collection, visualization |
| zipkin | 1 | storage, visualization, analysis |
Selected Tools
Web edition notes
This self-archived author version corrects duplicate tool-study associations in Table 1 and Figure 2, as well as a study-year indexing error in Figure 4. The totals of 45 tools and 111 studies are unchanged. It also updates Figure 5 after publication for readability. The Version of Record was published by ACM and is available at https://doi.org/10.1145/3786163.3788453.
References
Beyer, B., C. Jones, J. Petoff, and N. R. Murphy. 2016. Site Reliability Engineering: How Google Runs Production Systems. O’Reilly. https://books.google.com.br/books?id=81UrjwEACAAJ.
“CNCF Landscape.” n.d. https://landscape.cnf.io.
DeepSeek-AI. 2024. “DeepSeek-V3 Technical Report.” https://arxiv.org/abs/2412.19437.
Kosińska, Joanna, Bartosz Baliś, Marek Konieczny, Maciej Malawski, and Sławomir Zieliński. 2023. “Toward the Observability of Cloud-Native Applications: The Overview of the State-of-the-Art.” IEEE Access 11: 73036–52. https://doi.org/10.1109/ACCESS.2023.3281860.
Lewis, Grace A. 2013. “Role of Standards in Cloud-Computing Interoperability.” In 2013 46th Hawaii International Conference on System Sciences, 1652–61. https://doi.org/10.1109/HICSS.2013.470.
Linden, Frank van der, Bjorn Lundell, and Pentti Marttiin. 2009. “Commodification of Industrial Software: A Case for Open Source.” IEEE Softw. 26 (4). https://doi.org/10.1109/MS.2009.88.
Loutas, Nikolaos, Eleni Kamateri, Filippo Bosi, and Konstantinos Tarabanis. 2011. “Cloud Computing Interoperability: The State of Play.” In 2011 IEEE Third International Conference on Cloud Computing Technology and Science, 752–57. https://doi.org/10.1109/CloudCom.2011.116.
Niedermaier, Sina, Falko Koetter, Andreas Freymann, and Stefan Wagner. 2019. “On Observability and Monitoring of Distributed Systems–an Industry Interview Study.” In International Conference on Service-Oriented Computing, 36–52. Springer.
Pakhale, Kalyani. 2023. “Comprehensive Overview of Named Entity Recognition: Models, Domain-Specific Applications and Challenges.” https://arxiv.org/abs/2309.14084.
Picoreti, Rodolfo, Alexandre Pereira do Carmo, Felippe Mendonca de Queiroz, Anilton Salles Garcia, Raquel Frizera Vassallo, and Dimitra Simeonidou. 2018. “Multilevel Observability in Cloud Orchestration.” In 2018 IEEE 16th Intl Conf on Dependable, Autonomic and Secure Computing, 16th Intl Conf on Pervasive Intelligence and Computing, 4th Intl Conf on Big Data Intelligence and Computing and Cyber Science and Technology Congress (DASC/PiCom/DataCom/CyberSciTech), 776–84. IEEE.
“Prometheus and OpenTelemetry - Better Together.” 2024. OpenTelemetry. https://opentelemetry.io/blog/2024/prom-and-otel/.
“Prometheus Data Source - Grafana Documentation.” n.d. https://grafana.com/docs/grafana/latest/datasources/prometheus/.
-
grafana, prometheus, graphite, opentelemetry, elasticsearch, fluentd, kibana, logstash, jaeger, influxdb, ceilometer ↩